

The TwinCAT Analytics product family describes a complete workflow from the acquisition of data to its communication and historization to its analysis and visualization in web-based dashboards.
Data acquisition
The TwinCAT Analytics Logger is responsible for logging the data. It works in the real-time context of TwinCAT on the machine controller. It records data from the PLC and the process image in a cycle-synchronous manner and stores it in a file or transmits it to the outside world.
Communication
The system uses the IoT communication protocol MQTT. It features a lot of flexibility and a simplified IT setup based on the publisher-subscriber pattern, with the Analytics Logger and all other Analytics products acting as clients. They only know the connection data to the central message broker.
Data historization
To ensure that machine data can be stored permanently in databases, the TwinCAT Analytics Storage Provider features corresponding interfaces and carries out all required data handling. Users don’t need to have any knowledge regarding table structures and data links. They can access data by its name without having to use any SQL commands during the engineering process.
Data analysis
For data analysis, the two engineering products Analytics Service Tool and Workbench are used. Both have an identical structure and provide a graphical configurator for analysis. A toolbox provides numerous algorithms (e.g., simple flank counters with and without hysteresis), functions for the time analysis of machine processes, logical operators, envelope monitoring, productivity diagnostics, as well as various classifiers and comparators. You can analyze live data from machines via MQTT and historical data from the Storage Provider or log files. Particularly convenient is the automatic TwinCAT Scope configuration, which can be generated at the click of a button. All important variables of the configured analysis are directly available and can be supplemented with additional data. By means of the resulting links, analysis results can be dragged from the analysis and dropped into the charting tool to visualize results or highlight significant events in the data stream.
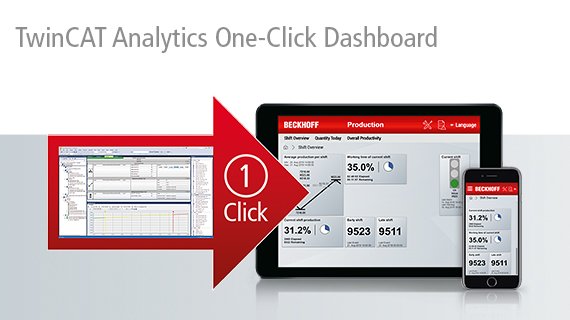
Dashboard
The goal is to implement a continuous data analysis independently of engineering tools. To accomplish this, the application designer or analyst can use the TwinCAT Analytics Workbench to automatically convert the configuration into PLC code that can be activated, read and edited. The code can run on an Analytics runtime parallel to the machines being analyzed. Based on the PLC code, the user can also generate a web-based dashboard with a modern tile design since for each algorithm at least one HMI control is available. For the dashboard itself, it is possible to customize header colors, logos, layouts, sort sequences, themes, languages and much more within the Workbench.