


I have a simple question.
Visible light hits a object (the ground), and is absorbed by some percentage (albedo). The object's thermal temperature rises, and it's black body radiation center line rises; in spectrum slightly and in intensity. Going from far infra-red, too close to visible light.
So, CO2 absorbs IR along it spectral absorption line. There's three major humps, in the IR spectrum. There's already enough CO2 in the atmosphere to absorb all IR in those bands (minus some widening of the band, as you increase the concentration); in the first mile of atmosphere.
So, the IR gets absorbed by the CO2 (element's electron valence band frequencies), which causes the gas to warm slightly. That energy is radiated back out, in all directions (up and down), at the CO2's black body spectrum. (the emission is not electron valence band frequencies, it's too cool for that, it's black body emission) Only a very small percentage of that emitted spectrum is within the CO2 absorption band. Some of this radiated energy, gets absorbed by CO2, and other spectrum get absorbed by water, ect.
My guess here, is that after the first absorption, the CO2 spectral intensity is pretty much zero from then on. Upper atmospheric CO2 wouldn't play much of a role. CO2's major contributions, is radiating half it's absorbed energy back downward, and feeding major greenhouse gases, such as H2O, by shifting energy to there spectrum.
The only real effect of increasing CO2; would be to cause this effect to happen closer to the ground. Compressing the heat down. So, is there some temperature rise due to the delaying, of that spectrum from exiting the earth? Or, is it the CO2 heating up, and the time it takes for the energy to be re-radiated? Or, is it more a function of spreading the spectrum back out? It seems to be actually, quite complicated, what happens to the energy after it's absorbed. I'm sure some energy is lost by simple conduction to other atoms.
Thread: ClimateGate
Results 41 to 60 of 71
-
12-29-2009, 04:35 AM #41
 Registered
- Join Date
- Apr 2006
- Posts
- 87
-
01-02-2010, 02:06 AM #42
Gold Member
- Join Date
- Apr 2006
- Posts
- 3206
Not exactly a simple question...with a qualified answer to come soon. Originally Posted by Wade

-
01-02-2010, 06:36 AM #43
Registered
- Join Date
- Apr 2006
- Posts
- 87
I think I misstated. The three spectral frequencies that are absorbed, are not do to valance band electron jumps. It seems it is due to the covalent bonds stretching and bending.
So, the CO2 molecule is heated up, and starts vibrating more. It transfers heat to other gases molecules. Oxygen, Nitrogen, ect. And, and all gases emit black body radiation.
Also, there are actually four absorption bands, but one of them overlaps water vapor, so it's swamped by that. Some studies show that most of the CO2 absorption wavelengths are completely absorbed in the first 30 to 100 feet of atmosphere.
Wade
-
01-03-2010, 04:07 PM #44
Gold Member
- Join Date
- Apr 2006
- Posts
- 3206
...Maybe a fresh slate would be a good place to start.... Originally Posted by Wade
For reference:
-
01-03-2010, 04:15 PM #45
Gold Member
- Join Date
- Apr 2006
- Posts
- 3206
Use Graphs in Previous Post as Reference
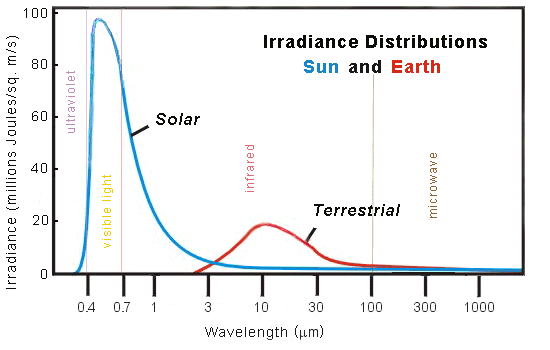
In the first graph is the blackbody spectrum of the Sun and the absorption spectrum of various gases. The Sun emits radiation mostly from the UV to IR, with a peak in the visible region around 500 nanometers (half a micron, a green color wavelength), though the majority of the energy emitted by the Sun is in the IR (the area under the curve to the right of the peak). Most of the shorter UV is absorbed by molecular oxygen and ozone in the in the mesosphere and the stratosphere, respectively. The small amount of near UV gets through to the troposphere and is what we must worry about in terms of sunburn. Visible light is mostly reflected from soil, rocks, water, etc. with only a little being absorbed (the color of most objects is largely due to reflection with a small amount due to absorption). Absorption of visible light usually involves electron transitions in most elements, a high temperature phenomenon, but not always. The Earth's surface mostly absorbs what is called "solar infrared", radiation with a wavelength of about 0.8-5 microns, represented by most of the area under the blackbody curve to the right of the peak. This absorption is mostly responsible for the Earth being warmed. Some of this incoming radiation is absorbed by water vapor and CO2 in the troposphere and is radiated both downward and back up into space before it reaches the ground. Most soil and rock is crystalline material, and these short IR wavelengths cause the crystal lattice to vibrate (no electron transitions to speak of). This vibrational energy is converted and radiated away as longer wavelength "terrestrial infrared" with a peak of around 10 microns, with some of this energy at shorter wavelengths, but more at longer ones greater than 10 microns, though the shorter stuff between 1-5 microns is more strongly absorbed by water vapor as you can see in the lower parts of the figure [/*There's a simple law called Wien's law that describes the maximum wavelength, in microns, emitted by a blackbody at some temperature, as equal to roughly 2900 divided by the temperature in Kelvins, and since the Earth's surface has an average temperature of around 290 K (about 15 C), this figures to be about 10 microns.*/] It is this longer wavelength radiation that is strongly absorbed by the water vapor and CO2, again with water vapor being the stronger absorber of the two. Because of the asymmetric shape the blackbody curve, there is always more area (and energy) under the part of the curve to the right of the peak. [/*There's another law called the Stephan-Boltzmann law that says an object radiates energy at a rate or power proportional to its temperature raised to the fourth power, so a little difference in temperature goes a long way. More about this later.*/]
Due to gravity, the density of the Earth's atmosphere drops off exponentially with increasing height, such that about 80% of the atmosphere is below the stratosphere i.e. in the troposphere, below about 40,000 feet (see atmos structure images). Hence, the majority of the heat absorbed by greenhouse gases occurs in the troposphere, and the absorption also varies exponentially with height according to a quantity called optical depth, which varies for each absorbing gas. For CO2 the optical depth is such that most of the heat absorbed occurs in the mid to upper troposphere (or an optical depth of about 1, i.e. I = Io exp(-1); and optical depth of 2 accounts for 86% of the absorption, and this happens in the first 50, 000 feet or so, down to a pressure of about 250 mb - see "Christy" graph ), with about half re-radiated down towards the ground, and the rest radiated up into space. As CO2 concentrations increase, the height at which an optical depth of 1 or 2 is encountered is not quite so high, so in this sense, the re-radiating level is lowered towards the ground. But the amount of heat trapped does not increase dramatically, and it does not increase unchecked. CO2 has been increasing approximately in a linear fashion since the late 20th Century. Because of the exponential variation of density with height, the response by the atmosphere is a logarithmic increase in temperature, a much slower change than a linear one (CO2 would have to increase exponentially in order to cause a linear increase in temperature). There are a number of estimates about the warming effects of the first 280 ppm of CO2 in the atmosphere, the long term global average for the last million years or so. However, a doubling of this leads to a relatively small additional increase in temperature (see ...-x2.png, and ...-x4.png). Doubling, tripling, or quadrupling CO2 does not lead to a proportional increase in temperature, because most of the heat is absorbed in the first two optical depths, such that adding more CO2 doesnt significantly change the optical depth. Its sort of like piling blankets on a block of ice. After the first two or three, the next five or six don't do much for you because, while the inner blankets are cool due to their proximity to the ice, the outer ones are at room temperature, and this heat eventually conducts inwards towards the ice (the room temp blankets are radiating according the fourth power of room temperature as opposed to the ice which is much cooler). If it didnt work like this, you cold preserve a block of ice indefinitely simply by piling enough blankets on it. This is what Lindzen has been trying to point out for some time now. We are already about 68% of the way towards a doubling of CO2 in the atmosphere, so it has already provided most of the warming that it can.
The other side of this argument is the sensitivity of the atmosphere to CO2, hence the different temperatures predicted for 280 ppm in ...-x2.png, and ...-x4.png (however, once estimated, an increase in CO2 still has a small effect). Lindzen I believe has the best (and lowest) estimate of sensitivity based on observations, which is why his predictions are at the bottom of both the 2nd and third graphs. John Christy has been arguing that the amount of heat predicted to be trapped in the mid to upper troposphere by the IPCC models has not appeared ("Christy"). Microwave sounding units (MSU) on satellites, and weather balloons, have only observed about 1/2 to1/3 of the predicted warming, and Lindzen has been claiming that radiometers on satellites have been indicating two to three times as much outgoing radiation, escaping to space, than the models assume, so both of these assessments agree. So the sensitivity of the atmosphere is grossly overestimated by the models.
I hope this makes sense. I recently read a little science blip article that mentioned satellite measurements of the upper atmosphere, the "thermosphere ", indicate that it is cooling. The temperature of the thermosphere is largely due to solar radiation, not re-radiated terrestrial radiation, but the author of course concluded that this was another indication of the far reaching effects of AGW, not a decline in solar activity. The trapping of more heat by the troposphere means less energy is radiated into and absorbed by the stratosphere, so the stratosphere cools slightly, but the stratosphere is well below the thermosphere. Dont let the apparent temperature of the thermosphere fool you. The "temperatures" are an indication of molecular speeds, and not bulk temperature, as there is no bulk atmosphere here. The density of the atmosphere is so low in the thermosphere, such that if you could stick your hand into it, you wouldn't sense any heat. Astronauts have to be cooled in their space suits because they absorb solar radiation and the "atmosphere" around them cannot conduct away any of this, or their own body heat, space acting like a perfectly evacuated Dewar, such that astronauts would roast in the heat they cant shed to their surroundings.
........There.
Now, that was too much like work, and I'm here for fun. So, back to reading about G.P. Bear in Washington.
(a very special thanks to my good friend Matt for clarification on this one)
-
01-04-2010, 04:39 PM #46
Gold Member
- Join Date
- Jan 2005
- Posts
- 2010
Now I realize that the only contemporary evidence that counts is that which supports AGW, but at some point..............
http://www.drudgereport.com/
-
01-04-2010, 05:14 PM #47
Member

- Join Date
- Nov 2006
- Posts
- 152
Here is a well known expert in the field.
http://www.kusi.com/home/78477082.html?video=pop&t=a
Kind of long but interesting.
Funny how all the cold now is either an anomaly or caused by global warming.
And of course anything in the Drudge report is BS and needs to be ignored.I used to be appalled, now I'm just amused.
-
01-05-2010, 06:03 PM #48
Gold Member
- Join Date
- Jan 2005
- Posts
- 2010
Well, yes! If you don't like the message then attack the messenger and if your are liberal attack folks like Drudge at every opportunity. They do become transparent.
Here is a bit more evidence, all headlines and all of them initially reported elsewhere and simply compiled by Drudge.
-
01-06-2010, 07:44 AM #49
Registered
- Join Date
- Apr 2006
- Posts
- 87
OK, that's a lot of info for me to absorb at one time. I want to start with your first statement. You make it sound like most visible radiation is reflected from the surface. But, NASA has quoted this graph many times. Originally Posted by fizzissist

It states that only 15% of light making it to the ground is reflected. About 1/4 of incoming is reflected off the clouds, another quarter is absorbed. I'm sure your right, that what is absorbed is mostly IR. What is reflected off the clouds is probably both. And, what is reflected off the earth is all visible, except where snow and ice are concerned.
This is the graph I'm used to seeing, when talking about irradiance of earth versus Sun. When I look at it, I can't help but believe that about a 1/3rd of the sun's irradiance is reflected back to space (mostly visible), and everything else is absorbed, and re-emitted at a longer wavelength.
-
01-07-2010, 05:11 PM #50
Member
- Join Date
- Nov 2006
- Posts
- 152
Did you look at the link I posted? My comment on Drudge was sarcasm. Originally Posted by jhowelb
Obviously did not come across as such.I used to be appalled, now I'm just amused.
-
01-07-2010, 05:17 PM #51
Gold Member
- Join Date
- Jan 2005
- Posts
- 2010
Yes, and understood and more of the same heaped up behind yours!
(.............They do become transparent.)
-
01-07-2010, 06:34 PM #52
Member
- Join Date
- Nov 2006
- Posts
- 152
I guess the printed word is inadequate.
Although I don't like them I will henceforth try to remember to use smilies. I used to be appalled, now I'm just amused.
-
01-07-2010, 10:26 PM #53
Gold Member
- Join Date
- Jan 2005
- Posts
- 2010
DITTO!
(No icon for tung-in-cheek double entendre)
-
01-09-2010, 11:21 AM #54
Gold Member
- Join Date
- Apr 2006
- Posts
- 3206
Good Series on Climategate Origins & History
Peer-to-Peer Review: How ‘Climategate’ Marks the Maturing of a New Science Movement, Part I
Posted by Patrick Courrielche Jan 8th 2010 at 7:06 am in Climate Change, Environment, Exclusives, Featured Story, History
How a tiny blog and a collective of climate enthusiasts broke the biggest story in the history of global warming science – but not without a gatekeeper of the climate establishment trying to halt its proliferation.
It was triggered at the most unlikely of places. Not in the pages of a prominent science publication, or by an experienced muckraker. It was triggered at a tiny blog – a bit down the list of popular skeptic sites. With a small group of followers, a blog of this size could only start a media firestorm if seeded with just the right morsel of information, and found by just the right people. Yet it was at this location that the most lethal weapon against the global warming establishment was unleashed.
The blog was the Air Vent. The information was a link to a Russian server that contained 61 MB of files now known as Climategate. Within two weeks of the file’s introduction, the story appeared on 28,400,000 web pages.
Not entirely the “death of global warming” as many have claimed – what happened with Climategate is much more nuanced and exponentially more interesting than the headlines convey. What was triggered at this blog was the death of unconditional trust in the scientific peer review process, and the maturing of a new movement – that of peer-to-peer review.
This development may horrify the old guard, but peer-to-peer review was just what forced the release of the Climategate files – and as a consequence revealed the uncertainty of the science and the co-opting of the process that legitimizes global warming research. It was a collective of climate blogs, centered on the work of Stephen McIntyre and Ross McKitrick, which applied the pressure. With moderators and blog commenters that include engineers, PhDs, statistics whizzes, mathematic experts, software developers, and weather specialists – the label flat-earthers, as many of their opponents have attempted to brand them, seems as fitting as tagging Lady Gaga with the label demure.
...Read the rest of Part 1 at:
http://bigjournalism.com/pcourrielch...vement-part-i/
-
01-09-2010, 09:56 PM #55
Registered
- Join Date
- Apr 2006
- Posts
- 87
NICE Story. I always wondered, if the release of this information sparked any threats against anyone. Originally Posted by fizzissist
Moral, never trust anyone, who seeks to control you. The motivation of Hilter, and Stalin, and Mao, and the Entitlement Crowd in Washington DC.
Burt Rutan on Global Warming: http://www.youtube.com/watch?v=Gm8va...ayer_embedded#
-
01-11-2010, 06:54 AM #56
Gold Member
- Join Date
- Apr 2006
- Posts
- 3206
Part II --Climategate Unfolds
Part One of this groundbreaking series appeared in Big Journalism on Friday. The story continues:
Peer-to-Peer Review (Part II): How ‘Climategate’ Marks the Maturing of a New Science Movement
PART II – The “hockey stick” graph inadvertently incites a new camp of “lukewarmer” skeptics. Climategate files make first appearance on the internet, but were in the hands of one person days before they were made public.
If history tells us anything, it shows us that inciting an audience is an extremely precarious undertaking. Inspiring one group of followers with a call-to-action can just as easily unleash the furor of another. Arousing a community to attack an indisputable villain can surprisingly lead to a circling of the wagons by the scoundrel’s close associates. Inciting is an unpredictable endeavor, best left for those with an innate ability to read a situation or an army on-the-ready to quickly take advantage of an opening.
So is the story of the hockey stick – just as quickly as it was used as a rallying call for warmists, it also inadvertently gave birth to a camp of skeptics..........
......The closest that you can currently get to the leaker is, intriguingly, someone from within the peer-to-peer review network.
**
As anyone who really researches Climategate will learn, the name Steven Mosher continues to pop up. When the story broke, it was Mosher who drew attention to the comment at the Air Vent. He was also the man that alerted Lucia of The Blackboard blog to the files. And he was the first to alert followers of ClimateAudit with a series of posts that included some of the emails.....
Please read the entire Part II at:
http://bigjournalism.com/pcourrielch...ence-movement/
-
01-13-2010, 02:49 PM #57
Gold Member
- Join Date
- Apr 2006
- Posts
- 3206
Part III Climategate Peer-to-Peer
"Steven Mosher is to Climategate what Woodward and Bernstein were to Watergate...
Having felt that it was highly unlikely that it was a hoax, Mosher went one step further. “Prior to [the emails] being public, I got confirmation from sources inside CRU that the files I held were real.”
The last email exchange within the Climategate files is November 12, 2009. Within the tight circle of climate skeptics, the significance of this date is telling. It is coincidentally the day before a crucial piece of information was denied to the peer-to-peer reviewers.
On November 13, 2009, a letter was sent by the Director of Information Services at the University of East Anglia to Steve McIntyre refusing his request for temperature data under the UK’s version of the Freedom of Information Act. The timing of the denial, which was a day after the last email in the Climategate files, and the fact that the files were titled FOIA.zip and FOI2009.zip, which are both abbreviated references to this Act, provides a striking indication to the impetus of the leak. This denial may have been just enough to incite someone from within the guarded establishment to give others a peak behind the green curtain.
http://bigjournalism.com/pcourrielch...ence-movement/
-
01-15-2010, 04:35 AM #58
Gold Member
- Join Date
- Apr 2006
- Posts
- 3206
More Emails!
FOI could be their nemesis...
http://www.judicialwatch.org/files/d..._NASA_docs.pdf
-
01-15-2010, 05:38 AM #59
Gold Member
- Join Date
- Apr 2006
- Posts
- 3206
Cooler Early Temps = Greater Warming
Climategate: Leaked Emails Inspired Data Analyses Show Claimed Warming Greatly Exaggerated and NOAA not CRU is Ground Zero
(Preliminary introduction – final much more complete report will be found here
The global data bases have serious problems that render them useless for determining accurate long term temperature trends. Especially since most of the issues produce a warm bias in the data.
The Climategate whistleblower proved what those of us dealing with data for decades already knew. The data was degrading and was being manipulated. The IPCC and their supported scientists have worked to remove the pesky Medieval Warm Period, the Little Ice Age, and the period emailer Tom Wigley referred to as the “warm 1940s blip.” They have also worked to pump up the recent warm cycle that ended in 2001.
http://icecap.us/images/uploads/NOAA...limategate.pdf
Anthony Watts, of WUWT has been using 2 weather stations in California as an example of how seriously bad the situation was. Now, we have confirmation.......Orland and Marysville ..... You don't need to be a climatologist to see what's wrong.
-
01-15-2010, 05:58 AM #60
Registered
- Join Date
- Apr 2006
- Posts
- 87
Nice interview with the guy the ClimateGate people feared.
http://spectrum.ieee.org/energy/envi...-climategate/2

 Reply With Quote